
Prediction markets
The spread is a toll booth, even when nothing happens
A prediction-market bid–ask spread can cost money even when the odds do not move. The bid, the ask and the fill tell that small story.

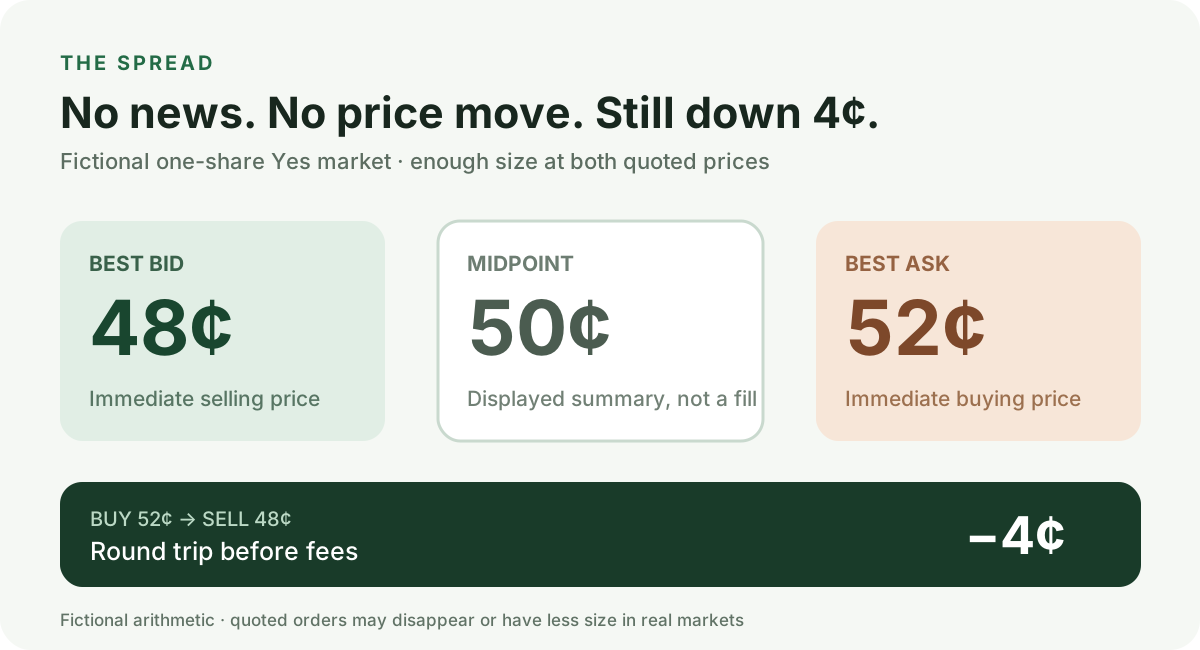
Imagine a Yes share in a prediction-market order book. The highest standing buyer offers 48¢. The lowest standing seller asks 52¢. The attractive number in the middle is 50¢. That is the one I am most likely to remember from the card.
Now imagine I want one share immediately. In this fictional book, the 52¢ ask has enough size, so I buy it. A moment later I change my mind. No news breaks. The event does not become more or less likely. The same 48¢ bid is still there and has enough size, so I sell immediately.
I paid 52¢ and got back 48¢. I am 4¢ down before any fee. The headline probability did not have to move at all.
Three numbers, three jobs
The bid is what a standing buyer is offering to pay. The ask is what a standing seller wants. The midpoint is a useful summary of the gap, but it is not automatically a price I can trade at. Polymarket explains that its displayed market percentage normally uses the midpoint between best bid and ask; when that spread exceeds 10¢, it displays the last traded price instead. Its display rule describes a card, not a promise that I can buy at the number on it.
This is why a strategy that says “the market was at 50%” has left out a vital line. Was the rule buying Yes? Then I want the available ask, not just the middle. Was it selling a position? Then I want the bid. A four-cent round trip on a one-dollar contract may sound small until the supposed edge was three cents.
The midpoint is a good summary. It is a lousy receipt.
There is another catch. My example gives both sides enough size to fill one share without moving the book. A larger order may consume the best price and reach less favorable levels. Polymarket's liquidity guide warns that desired size may move the price or fail to trade. The spread is the first cost I can see; book depth decides whether that first cost is the whole story.
A nicer chart will not pay the toll
If I hold the imaginary share until settlement instead of selling, the arithmetic changes. A Yes result paying $1 would make 48¢ gross gain on a 52¢ purchase; a No result would lose the 52¢ cost. That is a different risk from the immediate four-cent round trip. The CFTC's event-contract explainer is a useful starting point for the payout side of that calculation.
For research, I want to keep those stories separate: the market's displayed estimate, the quote available to enter, the quote available to leave, and the final event payout. If a strategy repeatedly enters and exits by crossing a similar spread, that cost can recur on every round trip, even when the displayed midpoint hardly moves.
The spread is not a villain. It is a piece of the receipt. I would rather see it before I decide the idea is clever.