
Prediction markets
The Brier score and a terrible rain forecast
The Brier score can test prediction-market forecasts. Three imaginary rain calls show why one confident miss can outweigh two correct guesses.

My imaginary weather forecaster has a very short working week. They say there is a 90% chance of rain on Monday, 60% on Tuesday and 20% on Wednesday. Monday stays dry. Tuesday rains. Wednesday stays dry.
Two days out of three, the forecast's more likely answer was right. That sounds like a decent headline. Monday is the problem: the forecaster was very confident about rain and got a dry day. How should that miss sit beside the two better calls?
The Brier score gives one simple answer for a yes-or-no event, including a probability forecast drawn from a prediction market. Write each probability as a number from 0 to 1. Write the observed outcome as 1 if the event happened and 0 if it did not. For each forecast, square the difference between the probability and the outcome. Average those squared differences. Lower is better. The U.S. National Weather Service's verification guidance uses this form for precipitation forecasts.
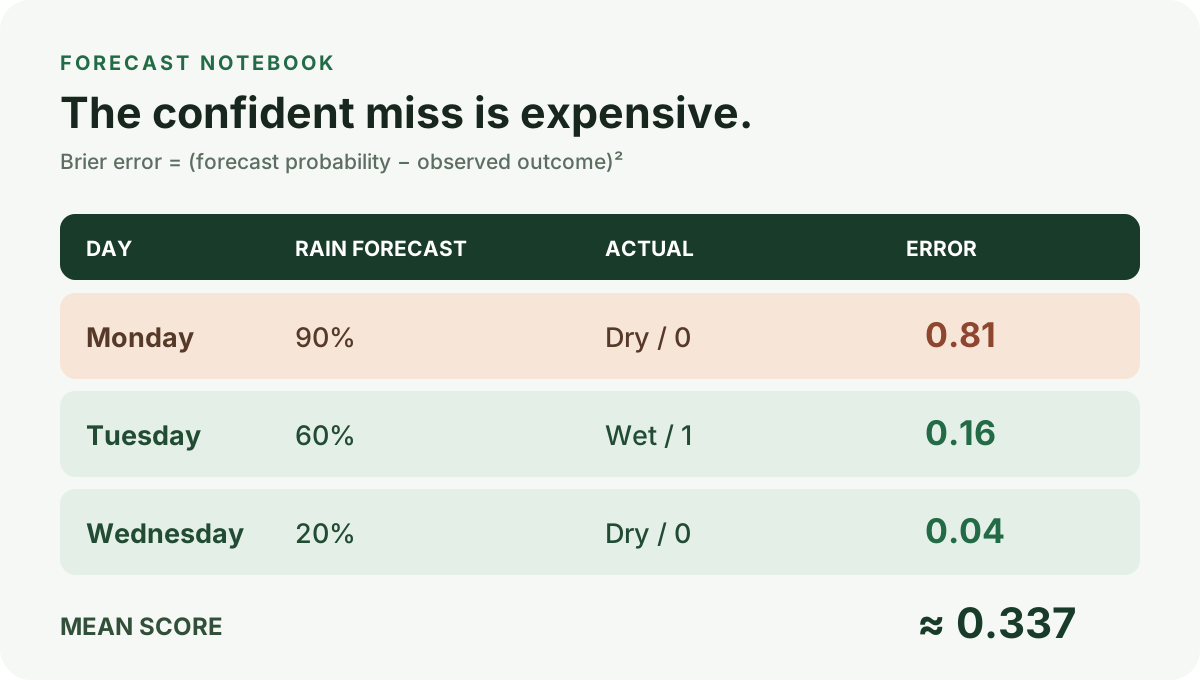
Monday's miss carries the score
Monday's score is (0.90 − 0)² = 0.81. Tuesday's is (0.60 − 1)² = 0.16. Wednesday's is (0.20 − 0)² = 0.04. The average is (0.81 + 0.16 + 0.04) / 3 ≈ 0.337.
The large Monday penalty is the point. A mild 60% forecast that comes true is not the same kind of statement as a 90% forecast that fails. The score lets confidence matter. It also means “I called two of three days correctly” has thrown away information the forecaster volunteered.
For a deliberately dull comparison, say someone else announced 50% rain every day. On this same three-day sequence, each day's squared error would be 0.25, for an average of 0.25. The unexciting forecaster beats our 0.337 in this tiny invented sample. That does not make permanent 50% forecasts good or prove the first forecaster lacks skill. Three days are far too few for a serious comparison, and a useful benchmark depends on the question and the base rate.
A market price is not automatically my forecast
It is tempting to take a prediction-market chart, treat every displayed percentage as a forecast, and score it against the final result. That can be a useful research design only after I fix the event definition, timestamp and price convention. A quote at 9 a.m. and one after the event is public are not competing predictions. A market's displayed midpoint may differ from an executable buy price; Polymarket describes its display convention here. And a contract's written resolution rule determines which observation counts as 1 or 0.
The Brier score measures the quality of probability statements against outcomes. It does not tell me whether buying a share at the available ask would have made money. Those are two different notebooks, even if both start with the same percentage.
I like the score because it refuses to let a confident miss disappear behind a row of green ticks. I would still want many more than three forecasts, all timestamped before the answer, before calling anyone good at seeing the rain.