
Building PaperMantis
I built a screen before I understood the market
I spent too much time polishing screens in the project that became PaperMantis before I understood the prediction-market numbers underneath.
I reached for a screen early.
I am a product designer. When I have an idea, my instinct is to put it on a screen, move things around, and see what feels wrong. So when I began building the prediction-market project that eventually became PaperMantis, I spent a lot of time making the first versions visible. I kept refining what I could see, and that felt like forward motion.
Some of that work was useful. But I was giving the interface more attention than the questions underneath it. How did these markets actually work? Which price was I looking at? What did an order book mean if I wanted to test a strategy? I had not worked through those questions deeply enough.
The first screen was wonderfully willing to agree with me. Screens do that. They rarely interrupt to ask whether the number I have so carefully aligned to an eight-pixel grid is the number I actually need.
A polished result screen is very good at making an uncertain answer feel settled.
Four things a single chart can hide
I originally wanted to study past trades, find patterns, and see if any of those patterns could say something useful about future markets. That sounds simple until a market gives you several numbers that look like “the price.” They do different jobs.
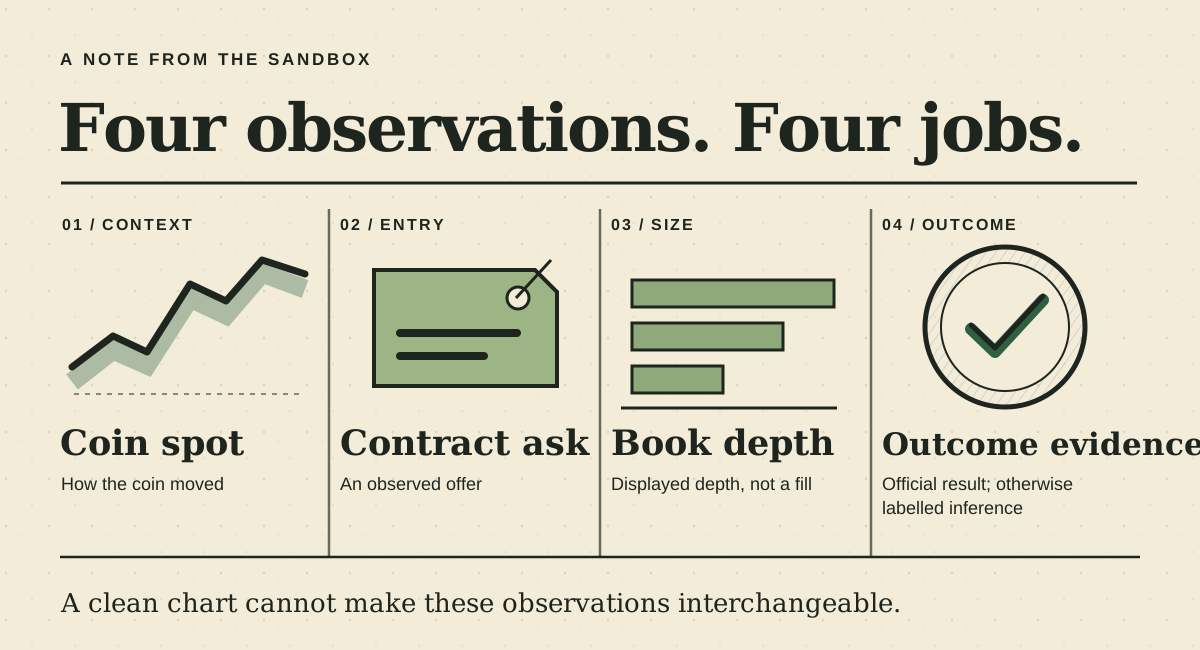
In a quote-driven historical test, a recorded ask sets the simulated entry price; it does not predict the outcome. In coin-outcome search, a rule predicts UP or DOWN from independently recorded spot movement available at the decision. A later virtual trade requires an observed book fill. Neither is a real order. If I treat a quote as an executable fill, a historical simulation can look more precise than it is. If I treat a contract quote as the coin's movement, I can read the direction of a chart backwards. The screen can still be tidy. The conclusion can still be wrong.
This is not just a PaperMantis naming problem. Polymarket explains that its large displayed probability can be the midpoint between bid and ask, rather than the price available to a buyer. Binance's spot glossary defines its own bid and ask fields for the underlying coin market. Same familiar words, different instruments. Putting both lines on one chart without explaining which is which would be a very efficient way to confuse myself.
That is the part that took me longer to appreciate. A designer can make a complicated thing easier to read, but first I need to know which complicated thing I am showing.
The lesson showed up again later
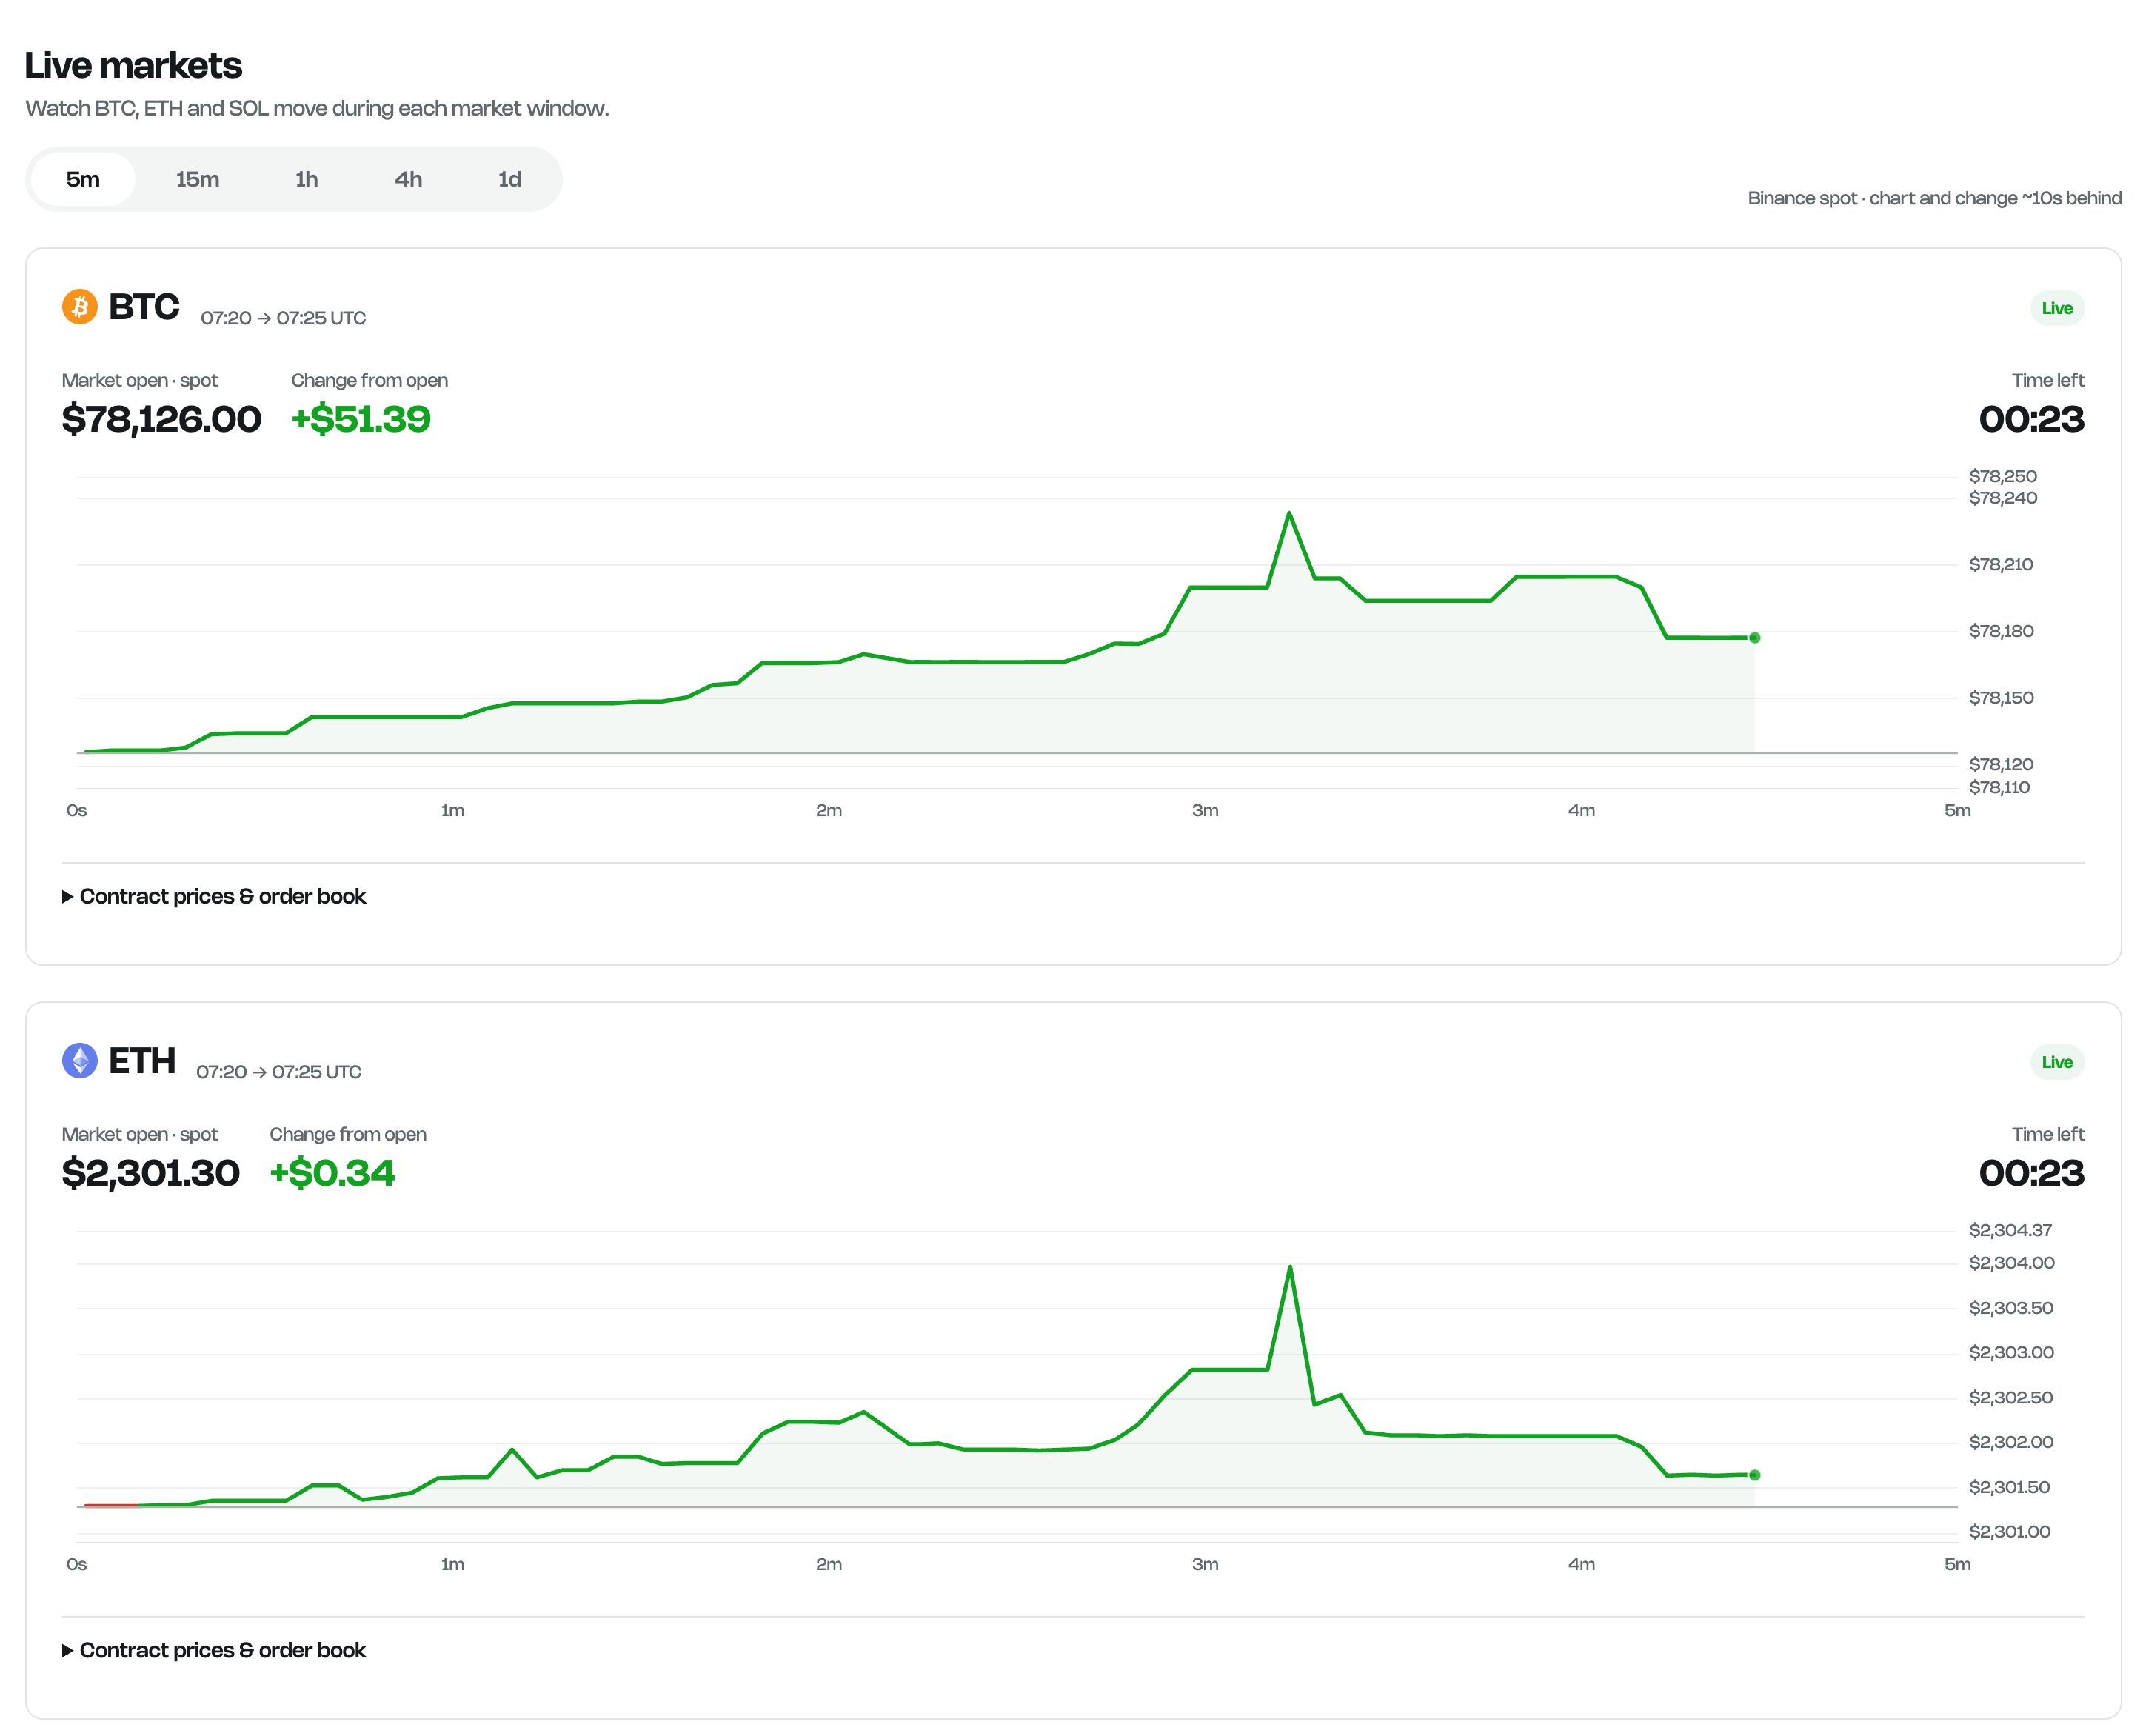
My early mistake was where I put my attention. A more specific example came in a later version of PaperMantis: the main Live Markets chart showed the movement of a prediction contract. The DOWN contract's ask could rise while the coin fell. The line was answering a valid question; it was simply not the question a reader might think the screen was asking.
The chart was behaving. The label I had in mind for it was not.
The current Live view leads with recorded coin spot movement and labels it as Binance spot context. Contract prices and order-book information remain available separately. This does not make the spot chart the official resolution source. It makes the different roles easier to see.
PaperMantis is roughly the fourth version of an idea I have been working on for about six months. Version two focused on Supabase and SQL. Version three followed a similar approach. Builder and Discover test recorded history. Compatible saved rules can then be followed on new markets in Portfolio with virtual money. PaperMantis does not place real orders.
I still care about how the product looks. I just want the design to come after a better set of questions: What exactly is this observation? Was it available before the decision? Is this a quote, a possible fill, context from another source, or an official result? What would the answer look like if one of those were missing?
Those questions make for slower screenshots. They make for a much more useful product.
If you have ever read a prediction-market chart and wondered what it was actually measuring, I would like to hear about it. That confusion is exactly the kind of thing I want PaperMantis to make visible.