
Prediction markets
Your 60% prediction lost. Was it bad?
Forecast calibration matters in prediction markets: one losing 60% forecast tells you little; a group of them can tell you more.

You gave an event a 60% chance. It did not happen.
The internet replies with its usual warmth: wrong.
But 60% did not mean “this will happen.” It meant “out of many comparable cases, I expect roughly six in ten to happen.” A single miss is entirely compatible with that claim. The hard part is collecting enough forecasts that the claim can be tested. That is forecast calibration, and it matters just as much when the 60% number comes from a prediction market.
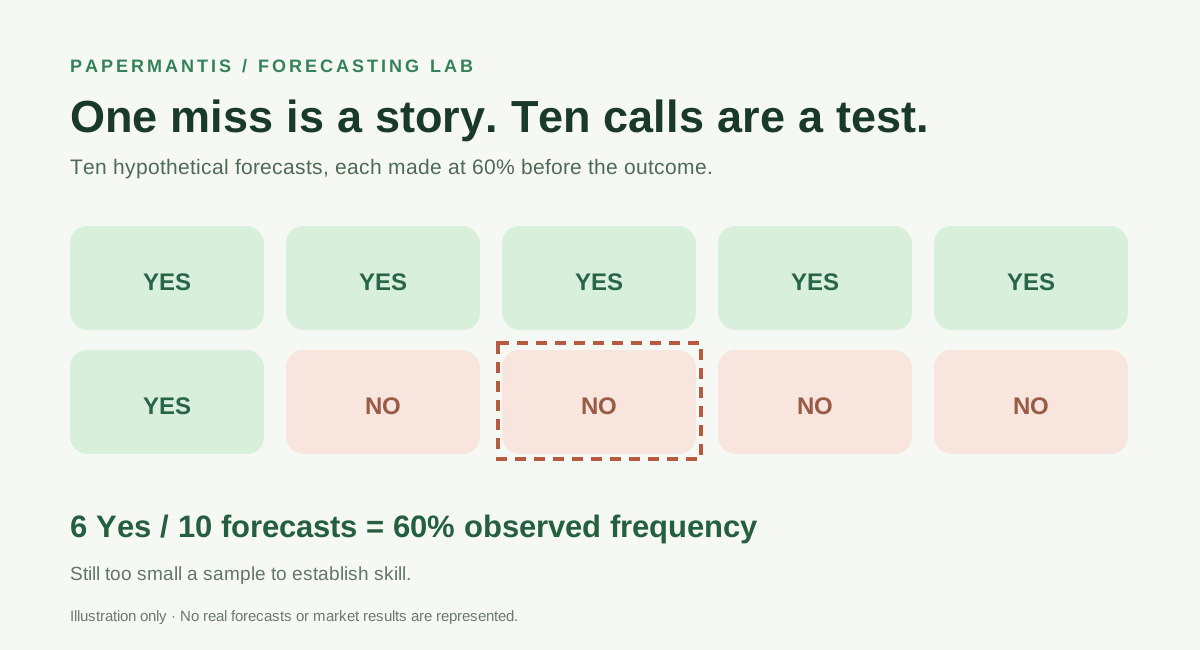
Suppose I record ten genuinely comparable predictions at 60%, all before their outcomes are known. If six happen, that small set lands exactly on the advertised frequency. If none happen, I should be much less comfortable with my process. Ten is still a tiny sample, but at least now I am looking at a track record instead of a dramatic screenshot.
Being calibrated is only part of it
Calibration asks whether forecasts made at a given probability happen at roughly that rate. Another question is whether a forecaster is informative: do their probabilities move away from 50% when there is a good reason? Someone who says 50% to every question may be perfectly cautious and not especially useful.
A common score for binary predictions is the Brier score: take the forecast probability, subtract the outcome coded as 1 for Yes or 0 for No, and square the difference. Lower is better. A 60% forecast that resolves Yes scores (0.6 − 1)² = 0.16; if it resolves No, it scores (0.6 − 0)² = 0.36. The Metaculus methodology appendix gives this form of the score and explains why evaluating a collection of forecasts matters.
Metaculus uses its own current scoring system for its platform; the simple Brier calculation here is an explanatory yardstick, not a description of how every Metaculus leaderboard works. Its scores FAQ also explains why proper scoring rules reward reporting what you actually believe rather than pushing every prediction toward 99% for dramatic effect.
The part that feels unfair
Imagine two people forecasting the same event. One said 60%, one said 99%. The event happens. Both are “right” in the ordinary sense. But the second person made a much sharper claim. If it had failed, the penalty should be much larger. A record of predictions has to remember confidence, not only the final Yes or No.
That is also why I would be wary of a gallery of winning market screenshots. It shows the survivors. It does not show the other 60% cards, the time each forecast was made, the rule that settled them, or the misses that an honest track record includes.
I could make a very convincing feed by posting only the 60% calls that landed. I would learn almost nothing from it. The dull spreadsheet with every dated call is the more honest story.
A useful public prediction record is not just “called it.” It has a dated forecast, a source, a reason, a resolution and a return to the page when the forecast was wrong. That last part may be uncomfortable. It is also the part that makes the page worth reading.